
When new users stop returning, check activation first
Compare signup cohorts, activation rates, and observation windows before deciding what to investigate.
On this page
Fewer new users came back this week. Before choosing a retention tactic, check where the change occurred. A lower return rate can reflect fewer people reaching the first useful task, a change after that task, or differences in who joined and when.
Start with comparable groups and explicit definitions. Then choose a framework that helps with the question the data actually supports.
Define the window and the denominator
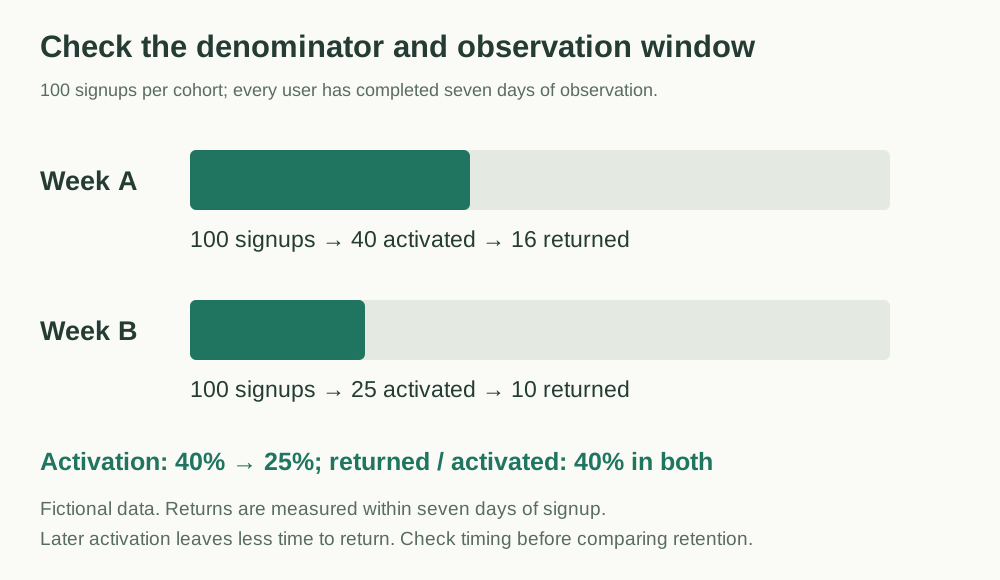
Fictional teaching case: an online scheduling tool compares users who signed up in week A with users who signed up in week B. Every user has completed a full seven-day observation period after signup.
In this example, activation means creating a timetable and inviting at least one member within those seven days. A return means editing the timetable on a different day after activation, still within the same seven-day period measured from signup. These are definitions for this example, not universal product metrics.
| Measure | Week A cohort | Week B cohort |
|---|---|---|
| Visitors | 1,000 | 1,000 |
| Signups | 100 | 100 |
| Activated users | 40 | 25 |
| Users who returned | 16 | 10 |
| Activated / signups | 40% | 25% |
| Returned / signups | 16% | 10% |
| Returned / activated | 40% | 40% |
The return rate among all signups fell from 16% to 10%. The proportion reaching activation also fell, from 40% to 25%. Among activated users, the observed return rate is 40% in both groups. This gives us a reason to investigate the first task before proposing a general re-engagement campaign.
It does not establish that retention is unchanged. Someone who activates late in the signup window has less time left in which to return. The groups are small, and their channel mix, device mix, and activation timing have not been checked. To compare post-activation retention over a fixed period, give every activated user the full observation period after activation.
State the gap before explaining it
An As-Is / To-Be comparison turns “users are leaving” into a more precise problem:
- As-Is: 25 of the 100 users in week B activated within seven days.
- To-Be reference: week A's 40% activation rate is a historical comparison, not an industry benchmark or a promised result.
- Gap: 15 percentage points, equivalent to 15 users with the same denominator of 100.
- Unknown: where users stopped and why.
Moving from 25% to 40% would be a 60% relative increase. Calling it “a 15% increase” confuses relative change with a percentage-point difference. Keep the denominator visible whenever you describe the gap.
The As-Is / To-Be guide. The useful output here is a bounded problem statement that another person can check against the data.
Use the funnel to locate the next investigation
AARRR separates acquisition, activation, retention, revenue, and referral. Use it to locate the part of the journey you need to inspect. This example contains no revenue or referral evidence; leave those parts unknown. The AARRR guide.
Next, inspect the 75 week B users who did not activate. Assign each user to one state at the end of their observation window:
- Never started creating a timetable.
- Started but did not finish creating one.
- Created a timetable but did not invite a member.
The counts for these branches are not yet known. Do not invent an even split or treat the largest-looking interface problem as the cause. Check event definitions and logs first, then use interviews or observation to understand what happened. A user who did not invite anyone may not need collaboration; the missing event alone does not show that the invitation button is hard to find.
If several branches need investigation, an issue tree can keep them separate. If a specific recurring error is supported by evidence, 5 Whys can help investigate the causal chain. Each explanation still needs evidence.
Leave with a question you can investigate
Write the current result, comparison, gap, window, and denominator before listing possible causes. For this case, the next useful question is: where did the 75 non-activated users stop, and what evidence explains those stops?
Practice data: Cohort counts and metric definitions. Keep the unknowns in the file visible as you work; a clearer funnel is the start of an investigation, not its conclusion.
Start with a useful outline
Practice materials
- Cohort counts and metric definitionsJSON · 1 KB