
When a weighted decision matrix changes its winner
Check hard limits, scoring evidence, and changing weights in a worked decision matrix. Try the interactive sensitivity exercise.
On this page
A decision matrix brings criteria, weights, and scores together so a team can discuss its tradeoffs. The total gives you a ranking under a particular set of assumptions. If a small change in those assumptions changes the winner, those assumptions deserve more attention.
This worked example checks three things: whether a hard limit has been averaged away, whether scores have comparable evidence, and whether the ranking depends too heavily on a disputed weight.
Apply hard limits before scoring
Fictional example: a team is choosing a provider for a design project with a budget cap of CNY 20,000. All prices and scores are invented for this exercise. They are not market quotes. Amounts remain in Chinese yuan (CNY).
| Option | Quoted price | Quality score | Delivery speed score | Cost score |
|---|---|---|---|---|
| A | CNY 12,000 | 3 | 5 | 5 |
| B | CNY 18,000 | 5 | 3 | 3 |
| C | CNY 26,000 | 5 | 5 | 1 |
Each score runs from 1 to 5, with higher scores always more favorable. Quality is assessed using the same trial task: 3 means the mandatory requirements are met but revisions are needed; 5 means both the mandatory requirements and the additional requirements agreed in advance are met. Speed reflects whether delivery fits the team's desired window. Cost scores use price bands agreed in advance; they are not the quoted amounts themselves.
These bands still involve judgment. Keep the scoring criteria and trial records. Turning a judgment into a number does not make it an objective measurement.
C is over budget. Exclude it or renegotiate its price before comparing scores. If the budget is a hard cap, better quality and faster delivery cannot compensate for exceeding it. Treating the budget only as a lightly weighted criterion can produce a winner the team cannot actually choose.
The same scores can produce different rankings
Compare the feasible options, A and B. Start with quality at 40%, speed at 30%, and cost at 30%. Multiply each score by its weight, then add the results.
| Option | Calculation | Weighted score |
|---|---|---|
| A | 3 × 0.4 + 5 × 0.3 + 5 × 0.3 | 4.2 |
| B | 5 × 0.4 + 3 × 0.3 + 3 × 0.3 | 3.8 |
Now give quality a weight of 60%, with speed and cost at 20% each. A falls to 3.8 and B rises to 4.2. None of the individual scores changed, but the ranking reversed.
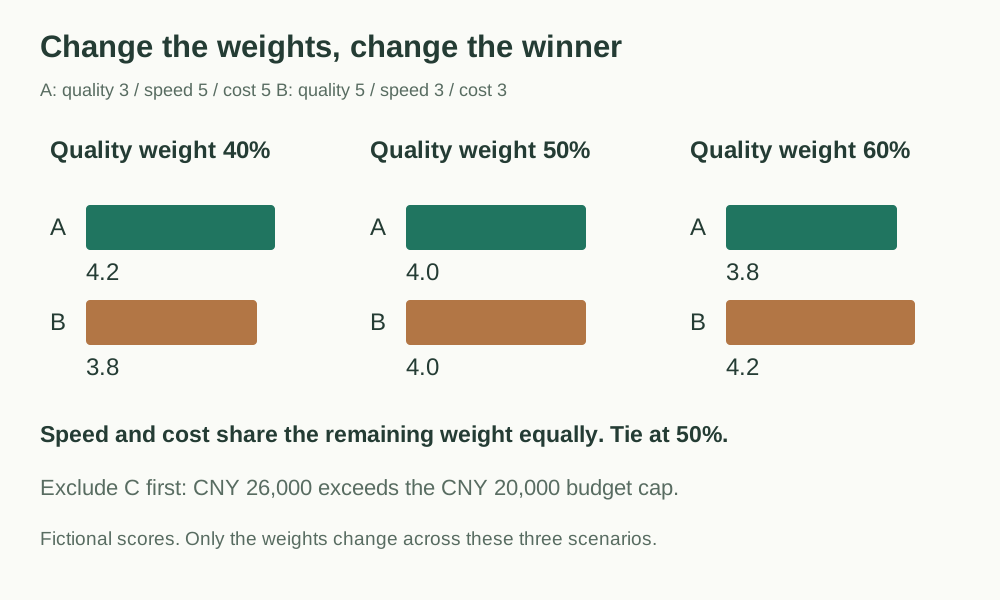
To find the tipping point, keep speed and cost equally weighted. If the quality weight is w, the other two weights are each (1 − w) ÷ 2. A's total is 5 − 2w; B's is 3 + 2w. At a quality weight of 50%, both score 4.
The 50% threshold follows from this example's scores. It is not a general rule for other decisions. If you stop weighting speed and cost equally, recalculate with the new weights.
Use the reversal to guide the discussion
If the team considers any quality weight from 40% to 60% reasonable, the current ranking is not stable. The next discussion should address whether the additional quality requirements justify extra cost and waiting time. A slide showing only the winner's 4.2 would hide that question.
Check the scores as well. If B received a 5 for quality based on promotional material while A received a 3 based on an actual trial, the evidence is not comparable. Ask both providers to complete the same small task, or use a plausible range of scores and check whether the uncertainty changes the outcome.
Watch for double counting. If “quality,” “less rework,” and “acceptance rate” all come from the same trial measure but each receives a high weight, the same advantage is being counted several times.
Leave a decision record you can explain
When using the Decision matrix, record hard limits first. Then agree on criteria, weights, and scoring evidence. Finally, check whether the same option leads across a reasonable range of changes.
Hard limits: Which requirements must be met?
Scoring criteria: What does each score mean?
Weighting rationale: Why do these tradeoffs fit the current goal?
Sensitivity: Which changes would reverse the ranking?
Decision: What will you choose, which tradeoffs will you accept, and what still needs checking?
Use the practice data to set quality to 40%, 50%, and 60%, keeping total weight at 100%. You should see A lead, then a tie, then B lead. That completes a first sensitivity check. Discuss the weights and evidence before making the decision.
Try changing the quality weight
Speed and cost share the remaining weight equally. The scores for A and B stay the same.