
Work through an RFM analysis with public retail data
Reproduce RFM calculations with UCI Online Retail data, explicit filtering rules, six worked customers, and complete downloadable results.
On this page
RFM summarizes how recently a customer bought, how often they bought, and how much they spent. The calculations are straightforward; the definitions determine what the result means. This worked example makes the filtering rules, dates, and limitations explicit so you can reproduce it.
Understand the data before grouping customers
The UCI Online Retail dataset contains historical transactions from a UK non-store retailer between December 1, 2010 and December 9, 2011. The business sold gifts and included wholesale customers. Each row is an invoice item, not a customer or necessarily a separate purchase.
Invoice numbers, quantities, prices, timestamps, and customer IDs let us describe recorded purchases. They do not establish acquisition costs, profit, customer intentions, or the behavior of people who never purchased. This exercise does not estimate lifetime value or confirm that a customer has churned.
Data attribution: Chen, D. (2015), Online Retail, UCI Machine Learning Repository, DOI: 10.24432/C5BW33, licensed under CC BY 4.0. The downloadable results are derived teaching materials.
Make the filtering rules reproducible
Apply these exclusions in sequence. Each exclusion count refers to the rows still present at that step, so the counts can be added without double-counting.
| Step | Rows excluded | Reason |
|---|---|---|
| Start | — | 541,909 source rows |
| Missing CustomerID | 135,080 | Cannot assign purchases to a known customer |
| Invoice number starting with C | 8,905 | Cancellation invoices |
| Quantity at or below zero | 0 | None remain after the preceding exclusions |
| Unit price at or below zero | 40 | Outside this positive-purchase definition |
| Eligible rows | — | 397,884 rows remain |
The result contains 4,338 customers and 18,532 distinct invoice numbers. The original table has 5,268 exact duplicate rows. We preserve them because the data provides no unique line identifier that establishes accidental duplication. We do not additionally remove postage or manual-item codes.
Our monetary measure includes positive purchases and does not subtract cancellation records. It is not net revenue or profit. A different question may require different rules; record those rules before comparing results.
Define R, F, and M precisely
Use December 10, 2011 as the fixed reference date, immediately after the recorded period. Using today's date would change the meaning of this historical exercise.
- Recency (R): calendar days between the customer's last eligible purchase date and the reference date. Lower means more recent. Use the dates in the source, without inventing a time zone.
- Frequency (F): distinct eligible invoice numbers per customer. Several line items on one invoice count as one purchase.
- Monetary value (M): the sum of quantity multiplied by unit price across eligible rows, in GBP. Calculate at full precision and round only for display.
For customer 12347, 182 eligible line items belong to 7 invoices. The last purchase was on December 7, so R is 3 days, F is 7, and M is GBP 4,310.00. Counting line items would incorrectly turn F into 182.
Read six customers before inventing segments
The six customer IDs below were deliberately selected for hand calculation. They are not a random or statistically representative sample.
| Customer ID | R: days | F: invoices | M: GBP |
|---|---|---|---|
| 12347 | 3 | 7 | 4,310.00 |
| 12348 | 76 | 4 | 1,797.24 |
| 12349 | 19 | 1 | 1,757.55 |
| 12350 | 311 | 1 | 334.40 |
| 12352 | 37 | 8 | 2,506.04 |
| 12353 | 205 | 1 | 89.00 |
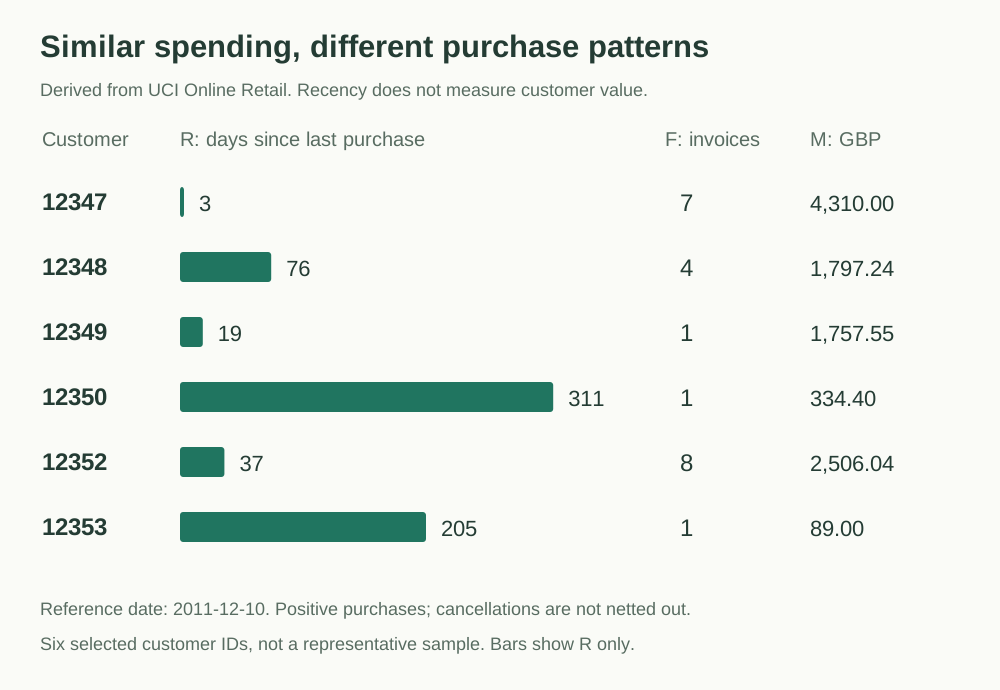
Customers 12348 and 12349 have similar total spending but different purchase frequencies. Customer 12352 has more invoices than 12347 but a longer gap since the last purchase. Those differences suggest questions about purchase cycles and needs; they do not supply the answers.
A 311-day gap means no eligible purchase was recorded during that interval. It does not prove permanent churn. The customer may have a one-off need, buy seasonally, or purchase elsewhere. This dataset cannot distinguish those explanations on its own.
Treat thresholds as choices to test
Two illustrative queries on the full result are:
| Condition | Customers | Possible next investigation |
|---|---|---|
| R at most 30 days and F at least 5 | 787 | What needs or purchase cycles explain recent repeat buying? |
| R over 90 days and F at least 5 | 71 | Is the gap unusual for these customers, given seasonality and normal purchase cycles? |
These groups do not overlap, but they do not cover all customers. The thresholds are analyst choices for practice, not validated marketing segments or recommended campaign rules.
Ranking all customers by M, the top 20% rounded up—868 of 4,338 customers—account for about 74.62% of the positive purchase amount. Calculate the concentration instead of assuming an 80/20 split. This describes spending concentration under our rules, not profit concentration.
The RFM guide and Pareto principle guide are currently available in Chinese.
Reproduce the result and record the limits
Start with the English source and reproduction notes. The original analysis date is October 3, 2026; the historical reference date remains December 10, 2011. Translation does not change either date.
- Source rows for the six selected customers: 402 rows, including records later excluded by the rules.
- RFM results for the six customers: a compact result to check by hand.
- RFM results for all customers: all 4,338 eligible customers.
- Definitions, counts, and checksums: the audit record for this calculation.
- Python analysis script: reads the official archive and writes derived files to a chosen directory.
Before applying RFM elsewhere, write down the customer identifier, observation period, reference date, cancellation and duplicate policies, and exact R/F/M definitions. Then state what additional evidence you need before acting on a group. A clear calculation supports a better question; it does not turn a behavioral summary into a causal explanation.
Start with a useful outline
Practice materials
- Source and reproduction notesMD · 3 KB
- Definitions, counts, and checksumsJSON · 3 KB
- RFM results for all customersCSV · 194 KB
- RFM results for six customersCSV · 1 KB
- Source rows for six selected customersCSV · 36 KB
- Reproducible Python analysis scriptPY · 5 KB