
Write a clear status update: results, risks, and next steps
Prepare a concise work update with clear results, evidence, risks, owners, deadlines, and requests. Includes eight illustrated examples.
On this page
“How is the project going? Give me a quick update.”
The difficult part is deciding what the listener needs to know. A list of completed tasks can hide the overall result. Cutting every detail can remove the evidence needed to make a decision. A useful update makes the current position, the important risks, and the next action easy to understand.
This article follows five steps: clarify the problem, organize the information, explain the results, propose a plan, and review the period. The approach works for a spoken update, a weekly project report, or a longer review.
Fictional example: a team is improving its customer service process. All people, schedules, business figures, and targets in this article and its eight diagrams are invented to illustrate reporting methods.
1. Form a judgment before listing activities
An update often loses focus because the writer has not yet decided what the evidence means. Is the project on track, behind its target, or ready for a change? A chronological account of meetings and revisions leaves that judgment to the reader.
Match the information to the audience's task. A project lead may need to decide whether a target is met, a delivery date is at risk, or extra resources are justified. “We coordinated with three departments” says little about those decisions. “First-response compliance improved by 7 percentage points, but remains 2 points below the 95% target” gives the discussion a clear starting point.
Separate observations from explanations
Organize each issue as an observed fact, its impact, a possible cause, and an action. Mark an explanation as a hypothesis until evidence supports it. If the answer is still unclear, state what you have checked, what remains unknown, and when you expect to update the judgment.
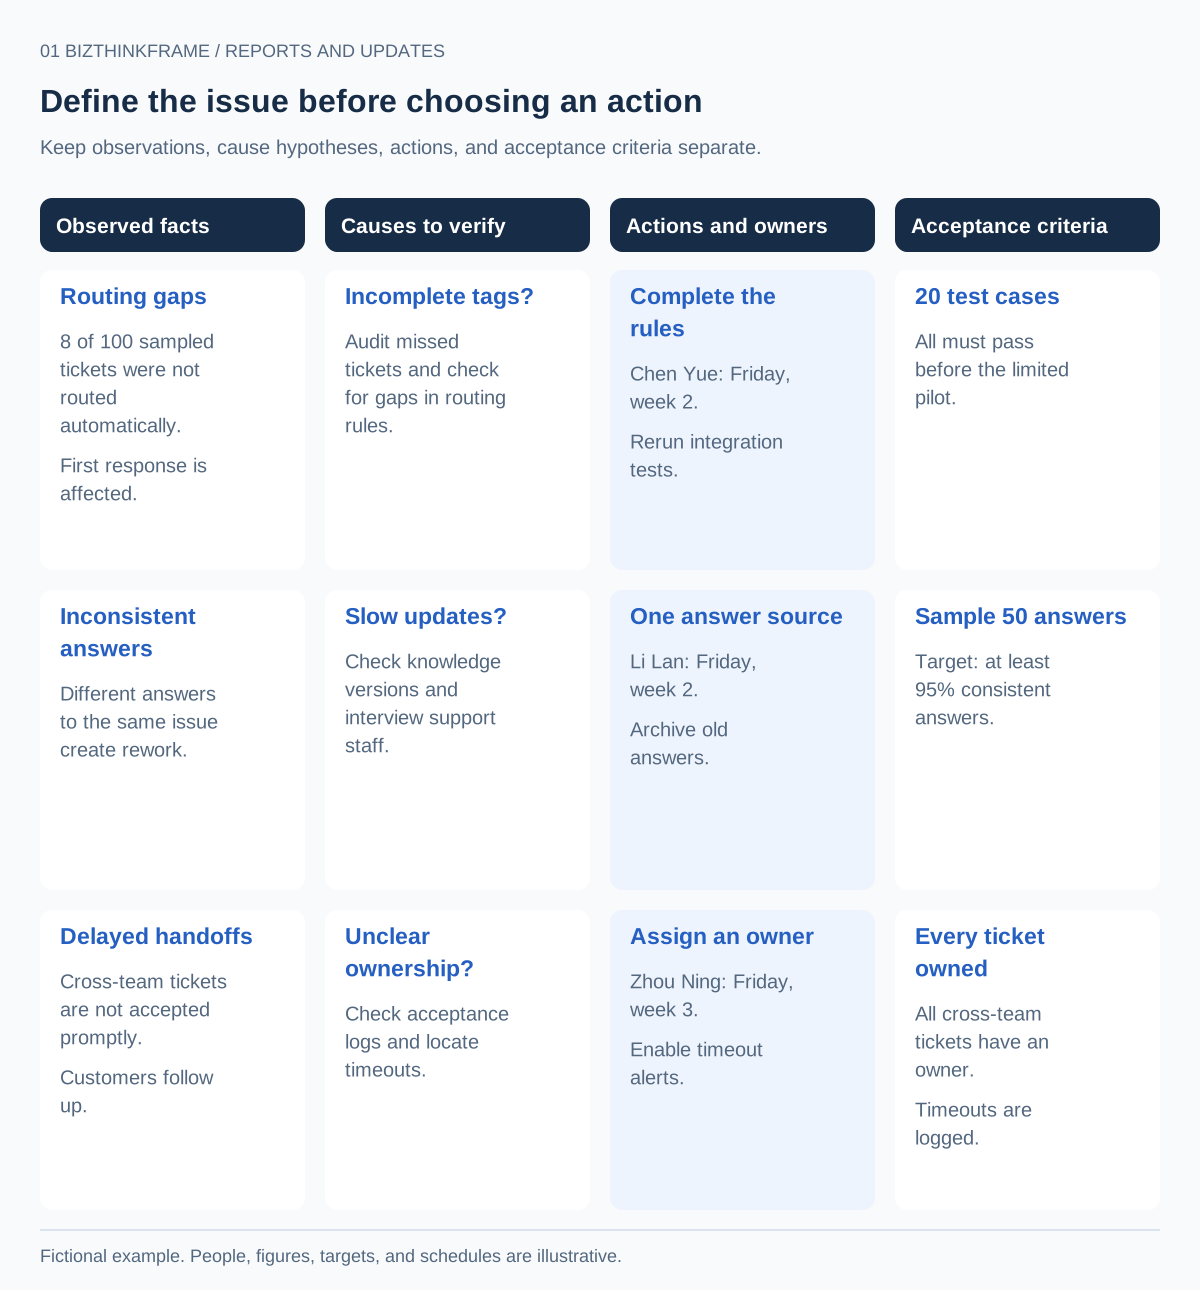
Figure 1. Turn broad complaints into issues that can be investigated, assigned, and checked. The cause explanations remain hypotheses.
For a larger project, also show how the work fits together. A simple map can connect the overall goal to the workstreams and shared resources, so the reader can place a detailed issue in context.
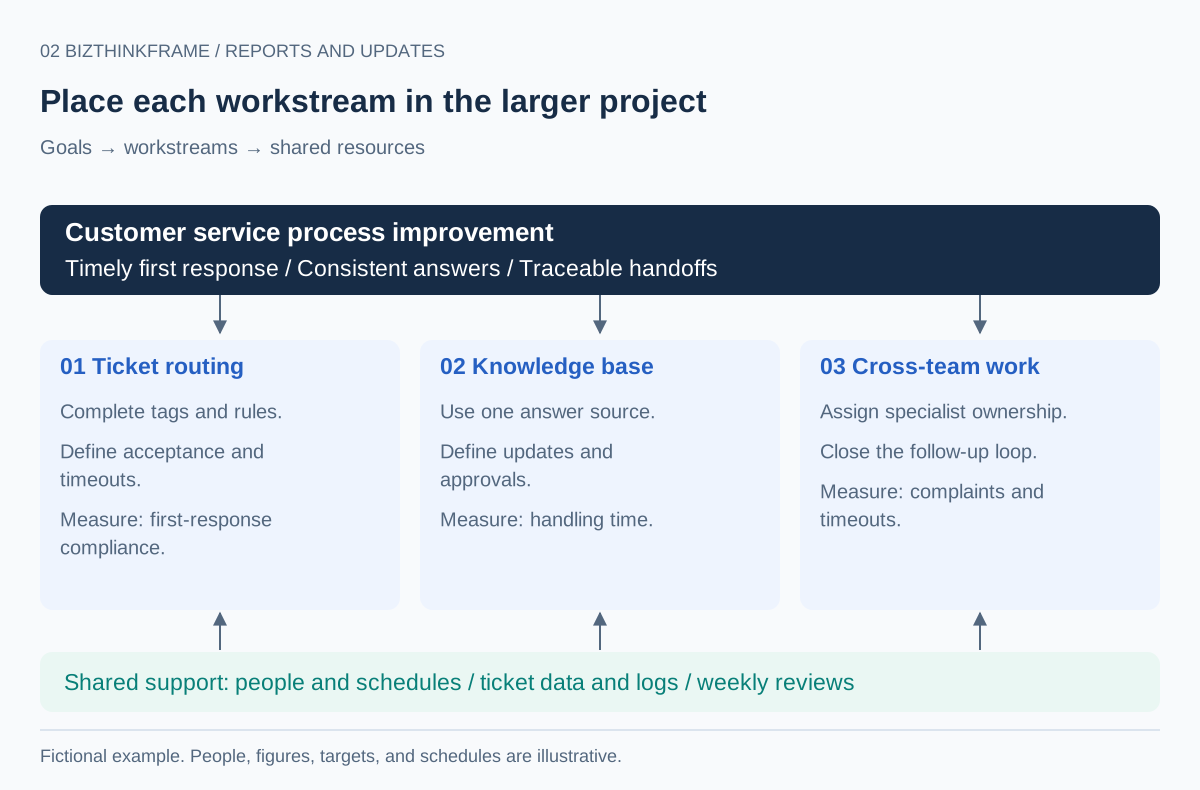
Figure 2. Show the whole project before expanding a particular workstream.
2. Lead with the result, then the risk and the request
Prepare four pieces of information: the result so far, the material risk, your proposed response, and the next action. Distinguish an update for awareness from a request for coordination or a decision.
A short spoken update in this example could be:
The earlier pilot improved first-response compliance from 86% to 93%, but we have not reached the 95% target. The next risk is integration testing: without another two person-days of support, the full rollout would move from week 4 to week 5. Please confirm that support by the end of Tuesday. In the meantime, we can keep manual routing. Week 4 remains conditional on passing all integration tests and the week 3 pilot meeting the target. I will update the test results and schedule on Friday.
The longer report can hold the detailed evidence and plan. Choose a diagram for the question it answers: a roadmap for timing, a swimlane for handoffs, or a results table for the target gap. A short summary does not require compressing every detail into one picture.
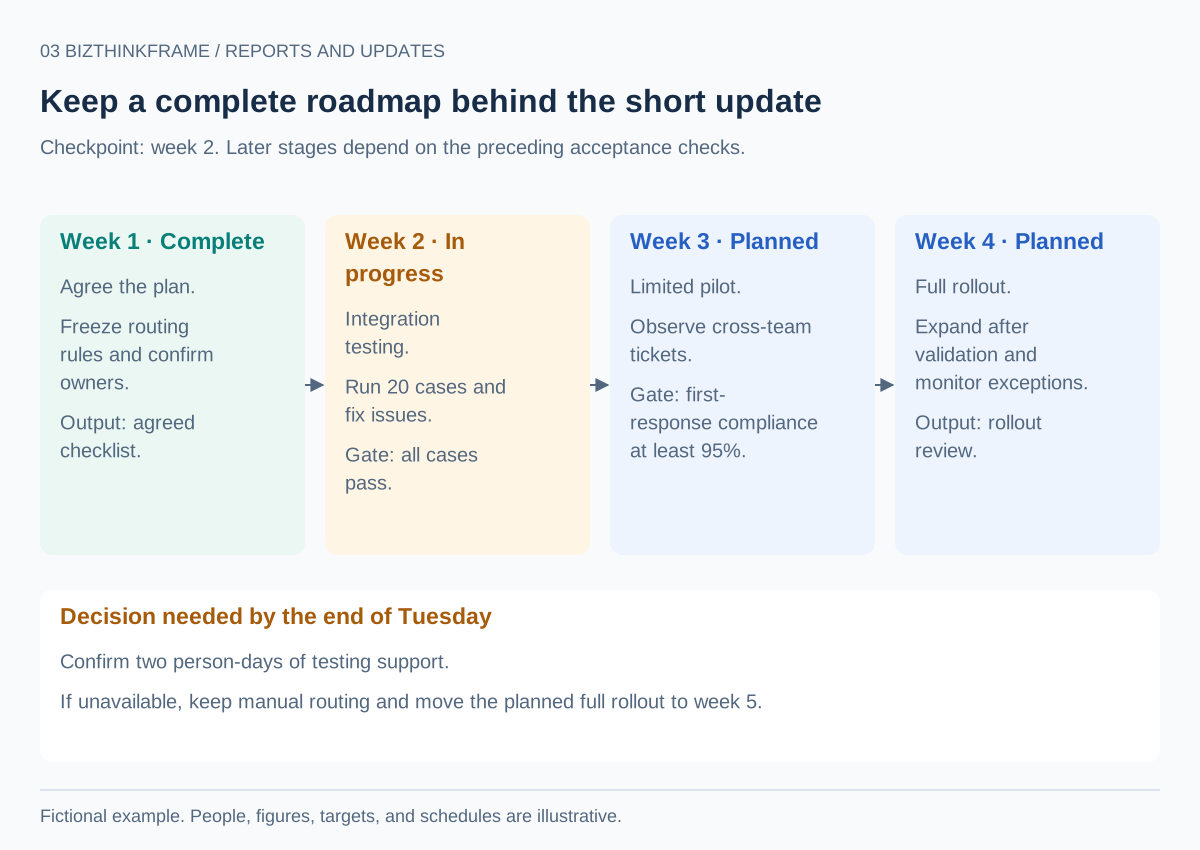
Figure 3. The next stages depend on acceptance checks; the dates are a plan, not a guarantee.
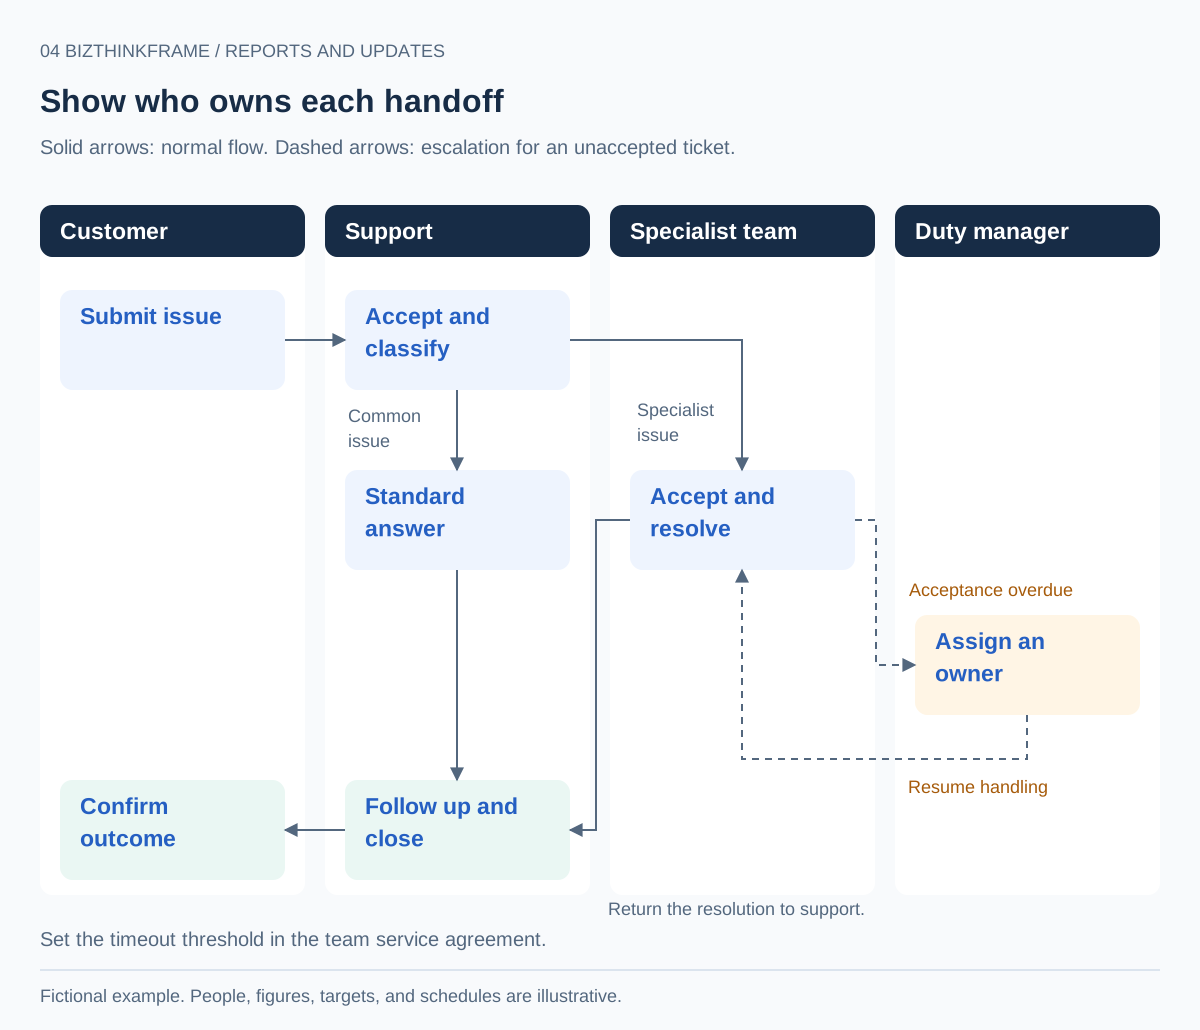
Figure 4. Use a swimlane to show ownership, handoffs, and the exception path. Agree the timeout threshold with the team.
3. Explain what changed, with a baseline and a target
Keep three levels separate: what was delivered, what changed after delivery, and what the change may mean for the business. A completed knowledge base is a deliverable. Lower handling time is an observed change. A claim about profit would require additional evidence.
In this fictional comparison, the same team closed 1,200 tickets in July and 1,200 in August. The figures use the same definitions in both periods.
| Measure | July baseline | August pilot | Target | Reading |
|---|---|---|---|---|
| Average manual handling time | 18 minutes per ticket | 12 minutes | At most 12 minutes | Down 33.3%; target met |
| First response within 30 minutes | 86% | 93% | At least 95% | Up 7 percentage points; 2 points short |
| Complaints per 1,000 tickets | 18 | 12 | At most 12 | Down 6 per 1,000; target met |
Handling time means human handling time per ticket. Complaint figures are rates per 1,000 tickets. The targets are assumptions for this example. Two of the three targets are met; “all targets achieved” would misrepresent the result.
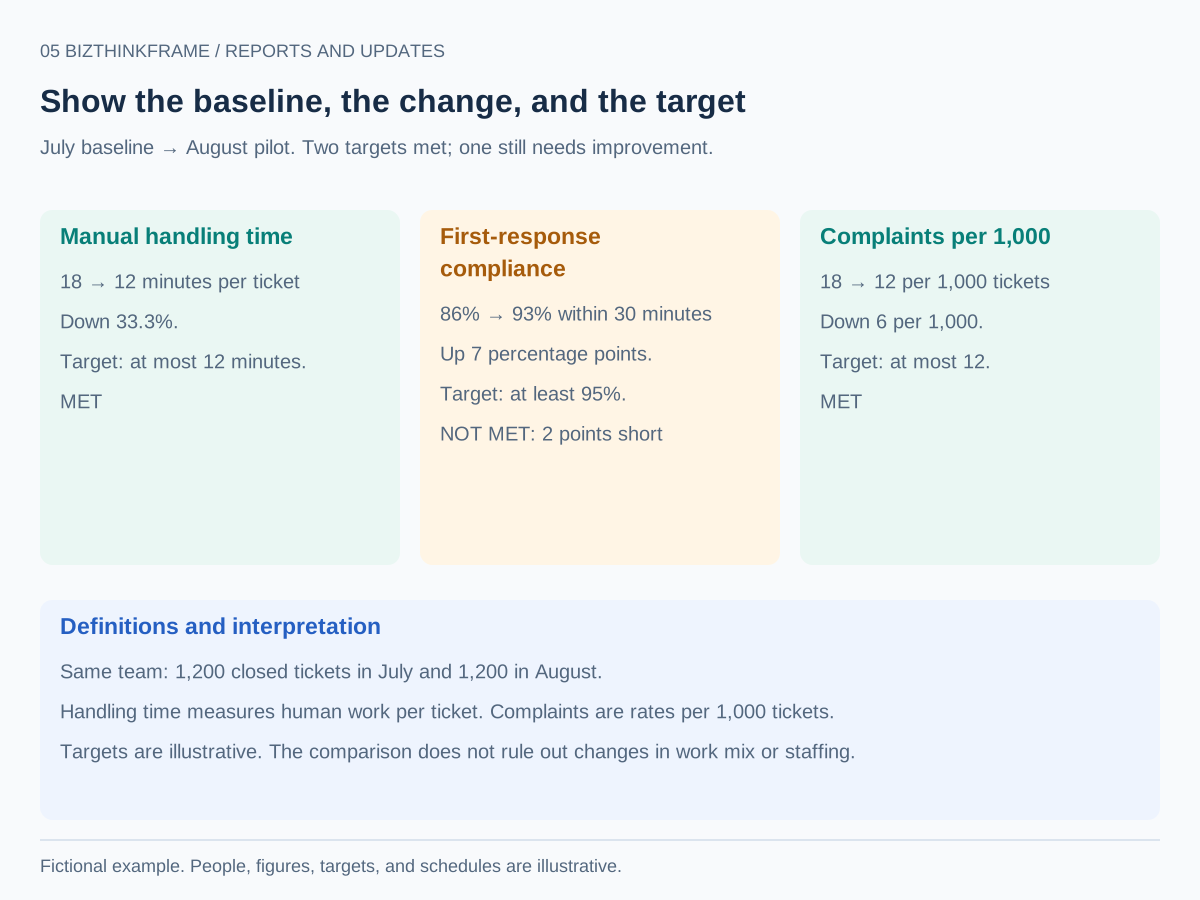
Figure 5. Baselines, targets, denominators, and definitions make the result checkable.
The comparison shows change, but does not isolate the process change as its cause. Work mix, staffing, and other factors may also have changed. Do not turn a before-and-after result into a causal claim without supporting evidence.
When the output is qualitative, describe what is available, who can use it, and what has been checked. There is no need to invent a return-on-investment figure for a process document or a newly agreed handoff.
4. Make the next step executable
A plan needs an owner, a deadline, an acceptance criterion, and any dependencies. “Continue improving collaboration” leaves too much undefined. “Chen Yue will complete all 20 integration test cases by Friday of week 2; all must pass before the limited pilot” can be followed up.
The example requires two additional person-days of testing support, confirmed by the end of Tuesday. Zhou Ning then owns the week 3 pilot, with first-response compliance of at least 95% as its acceptance threshold. Li Lan owns the planned week 4 rollout, conditional on the pilot passing. If resources are unavailable, retain manual routing and move the planned rollout to week 5. If validation fails, investigate before expanding; a later date alone does not remove that dependency.
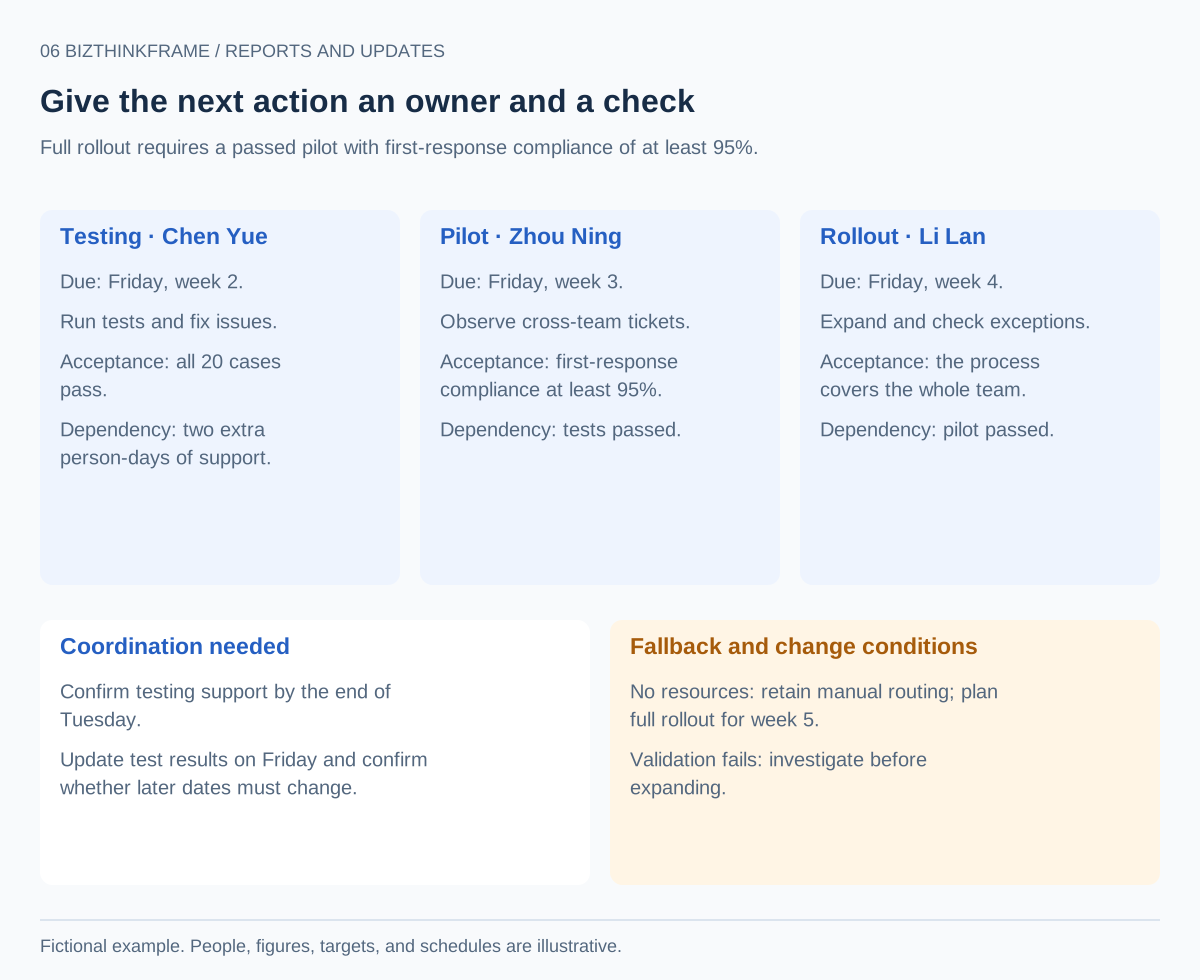
Figure 6. Include the request for support and the condition that would change the plan.
For annual planning, translate the direction into quarterly priorities and checks. Agree each metric's denominator, period, and sampling approach when the plan is approved. Record actual results separately from targets.
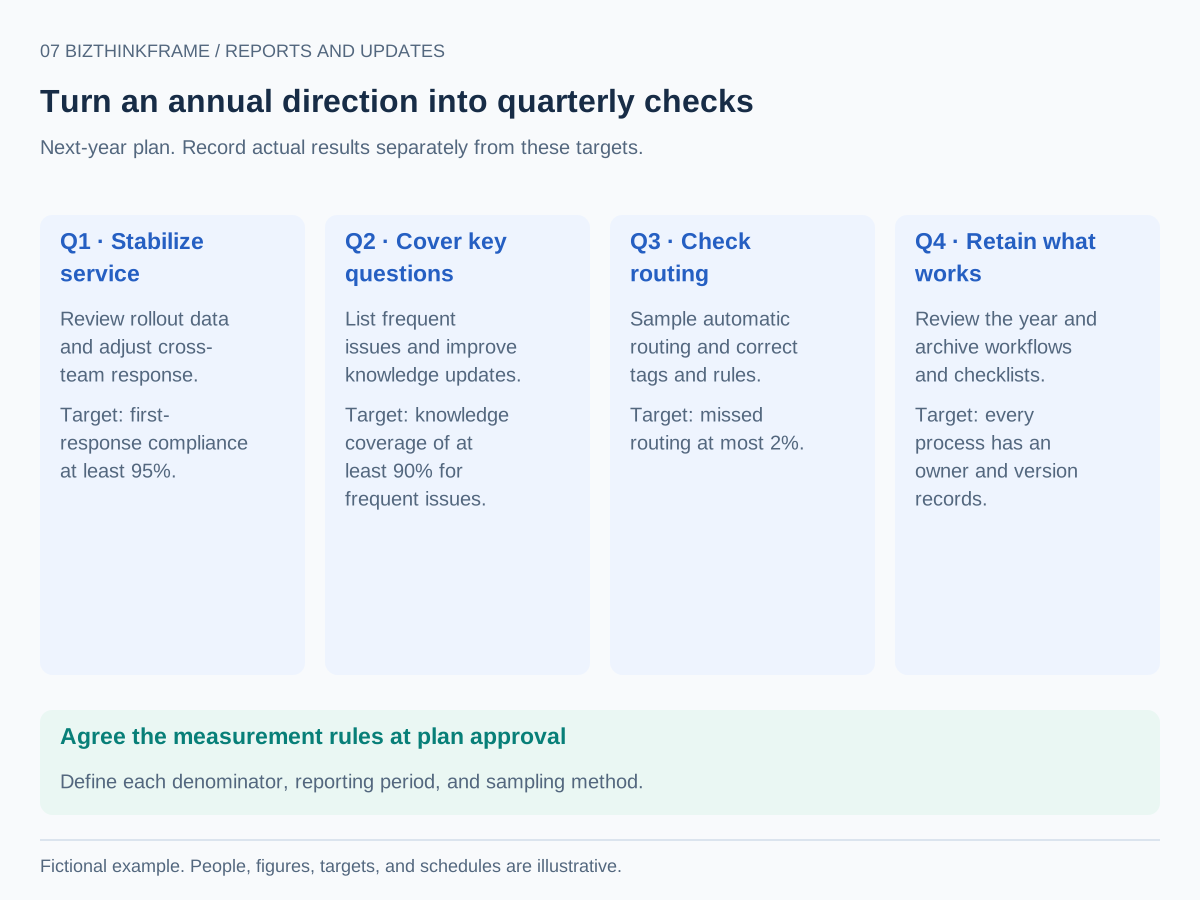
Figure 7. Quarterly checkpoints make an annual direction easier to review. These are future targets, not completed results.
5. Review results and improve the next cycle
A period review should connect the original goal, the observed result, the main differences, and the next adjustment. In this example, two targets are met and first-response compliance still needs improvement. The next step is to verify cross-team handling before expanding the rollout.
Keep the schedule separate from the result. A Gantt bar shows when a task is scheduled. Its length does not demonstrate how much is complete or whether the work met its acceptance criteria.
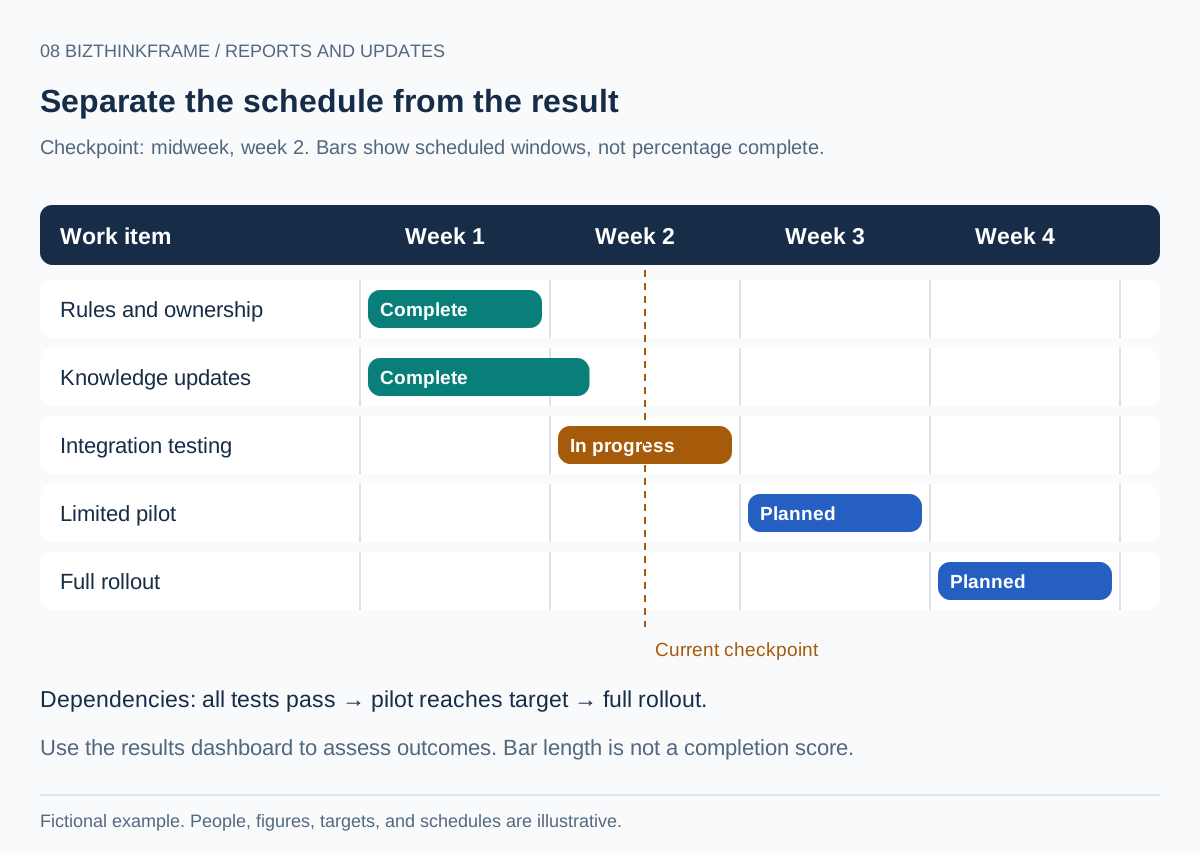
Figure 8. The checkpoint is midway through week 2. Pilot and rollout remain conditional on the preceding checks.
Make the lesson specific enough to change a future action. “Coordination should improve” is difficult to use. “Testing support was not secured early enough; at the next plan signoff, confirm the owner and the available testing window” identifies a practical change.
Check the update before sending it
- Does the opening state the overall position?
- Are the period, definitions, baseline, and supporting evidence clear?
- Does each material risk include its impact, response, and remaining unknowns?
- Does the next action have an owner, deadline, and acceptance criterion?
- Is it clear whether the reader is being informed, asked to coordinate, or asked to decide?
Use the editable outline below to prepare your own update: overall position; key result and evidence; risk and impact; proposed response and reason; next action, owner, deadline, and acceptance; and the specific request. Keep only what helps the reader make the required judgment, with supporting detail available when needed.