
Which chart fits your work update? Start with the question
Switch questions for the same complaint totals, check chart conditions, and retain the choice rationale, definitions, and missing evidence.
On this page
State the question, then check whether the data support it. The same complaint totals can answer “Which category is larger?” with bars or “What makes up the whole?” with a 100% stacked bar. One month of totals cannot answer “How does this change over months?”
Follow those choices using fictional counts of 45, 30, 15, and 10. Switch questions beside the explanation to see the diagram or missing conditions. For your own work, paste a question and its definitions, confirm the relevant conditions, and copy or download the choice rationale and record.
Start with comparable material
Original fictional exercise: September 2026 contains 100 valid complaints. Each is assigned once to its main reported issue. This constructed example has no duplicates, missing values or unclassified records. Categories describe reported issues, not verified root causes.
| Main issue | Complaints | Share of 100 valid complaints |
|---|---|---|
| Stockouts | 45 | 45% |
| Late delivery | 30 | 30% |
| Packaging | 15 | 15% |
| Other | 10 | 10% |
| Total | 100 | 100% |
Download the category-total CSV. These are supplied aggregates, not categories inferred automatically from raw text. If a real complaint can have several tags, tag counts may exceed the complaint total. They cannot be treated as exclusive parts of that whole.
Question one: which category is larger?
Use bars on a shared zero baseline, retaining category names and units. Stockouts account for 45 complaints, 15 more than late delivery's 30. The longer bar does not establish greater severity or easier resolution.
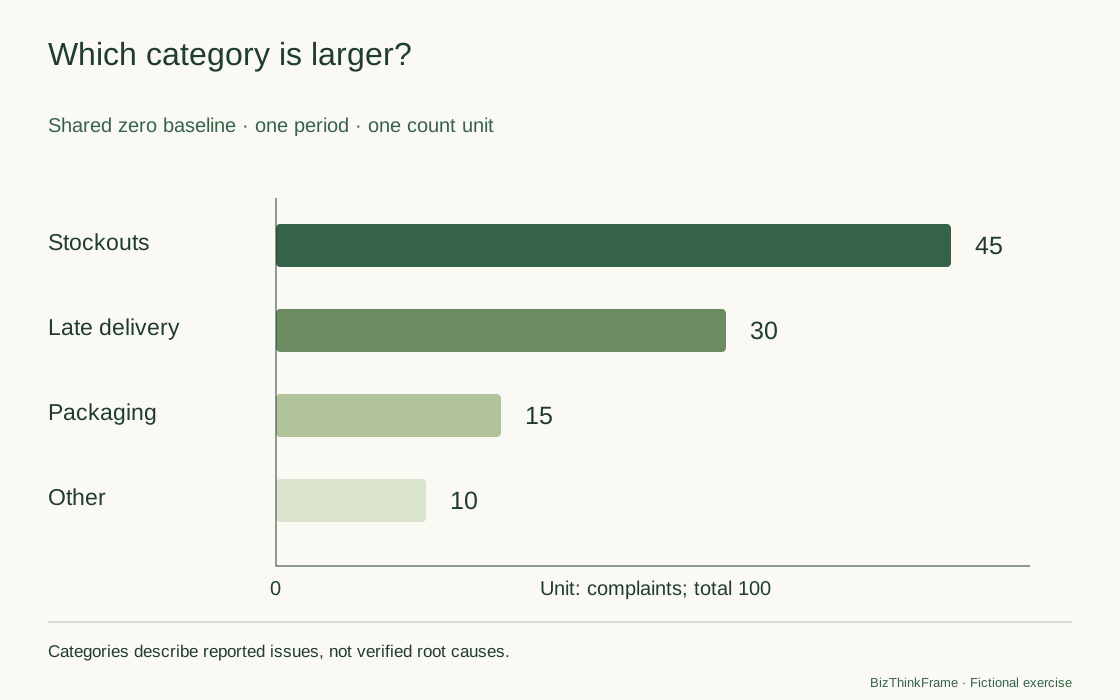
A truncated bar baseline can exaggerate length differences. Showing only three categories without explaining the exclusion of Other changes the visible scope. Fix the baseline, units and scope before choosing colors. Keep the table when exact values matter.
Question two: how is the whole composed?
The same data can form a 100% stacked bar because categories are exclusive and cover these 100 complaints. Stockouts and late delivery total 75 complaints, or 75% of the whole. This is a calculated concentration, not an assumed 80/20 pattern.
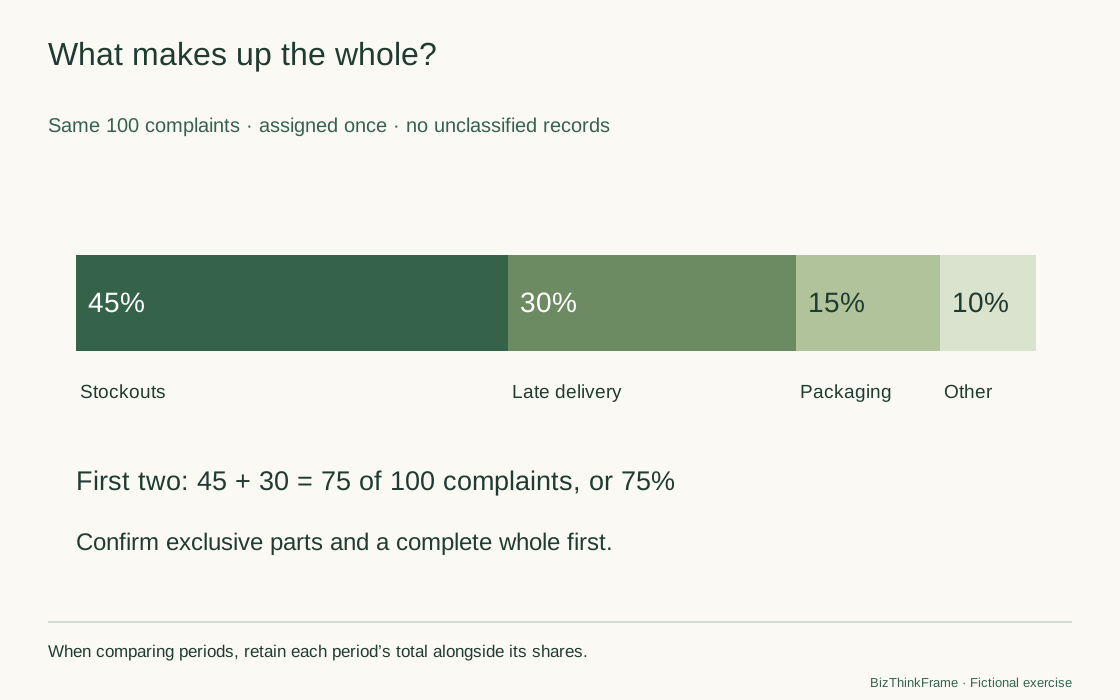
Across months, equal shares need not mean equal counts: 45/100 and 90/200 have the same percentage but different workloads. Display the total beside the composition. Bars or a table may be easier than a pie chart when categories are numerous or values are close. Percentages do not automatically require a pie chart.
A different question needs different evidence
| Relationship | Consider | Confirm first |
|---|---|---|
| Category magnitudes or ranks | Bar chart | Comparable measures, units and populations; clear baseline and order |
| Change over time | Line or period-column chart | Time order, real intervals and consistent definitions; whether values are period flows or cumulative stocks |
| Parts of a whole | 100% stacked bar | One complete denominator and exclusive parts covering it |
| Variation in elapsed times | Histogram or individual dot plot | Individual values or defined bins and frequencies, sample size and unit |
| Association between two variables | Scatter plot | Paired observations from the same objects and labeled axes; association does not establish causality |
Four totals from one month cannot establish a four-month trend. A mean does not reconstruct individual observations. A useful tool asks for missing material instead of inventing a plausible line.
The Office for National Statistics guide connects chart choice to data type and the relationship to communicate, favoring simple familiar charts.
Change the question and check what these data can show
The same fictional counts—45, 30, 15, and 10—support category or composition questions. Other questions need different evidence.
Bar chart
Compare category magnitudes on a shared baseline. Horizontal bars leave room for longer labels.
Normally start bar lengths at zero, label the unit and explain the ordering.
Stockouts total 45 complaints, 15 more than late delivery's 30. Counts do not establish severity or root causes.
Read the complete chart-choice record
This article's fictional complaint case, not business results.

Work-report chart choice
Question: Which complaint category is larger?
Scope and source: Fictional September 2026: 100 valid complaints, one main issue each; stockouts 45, late delivery 30, packaging 15, other 10. Categories are complete and exclusive.
Relationship: Compare categories or ranks
Are definitions, units and populations comparable? Confirmed
Suggestion: Bar chart
Compare category magnitudes on a shared baseline. Horizontal bars leave room for longer labels.
Normally start bar lengths at zero, label the unit and explain the ordering.
Suggestions use your confirmations; source data are not verified. Illustrations do not represent your data.
Personal text is not saved or uploaded; copy or download before reloading. Diagrams illustrate only the article's example. Suggestions use your confirmations and do not verify source data. Confirm conditions again after changing material or the relationship.
Write a statement that matches the chart
In this fictional September classification, stockouts account for 45 complaints and late delivery for 30: together, 75% of 100 valid complaints. Review their source records while separately checking infrequent but serious issues. The classification does not establish root causes or prove that addressing these two categories gives the largest benefit.
The statement retains the observation, denominator, period and proposed next step. Keep the chart title equally specific. “We found the root cause of 75% of problems” goes beyond the data.
Use the blank chart-choice practice pack to record the question, relationship, scope, missing information, reasons and accompanying statement. The chart selector lets you copy or download this record; it does not read CSV files, plot your data or verify source records.
For a change in rates, use the rate-change tool. To examine differences a mean might conceal, continue with the elapsed-time distribution exercise.
For an AI-assisted review of a chart statement, include the question, complete data scope, units, denominator, and period. Ask it to distinguish observations from unproven explanations and check for omitted categories or missing records. Do not accept a time trend invented from one month of totals.