
Why late requests can increase while average elapsed time falls
Paste two-period elapsed times, check the mean, median and late counts, and retain missing/open records and limits in your report.
On this page
A lower mean tells you that a sample's average is smaller. It does not guarantee that every request is faster or that fewer requests exceed an agreed limit. Report sample size, distribution and late-request counts alongside the mean to retain differences compressed into one number.
Recompute twenty original simulated records, then change the late threshold in the article to see why the mean and late count can tell different stories. Paste your own two-period records to keep a calculation summary and an editable report. The CSV and Python reproduction materials remain available.
Define the time being measured
Original fictional exercise: the earlier period is September 7–13, 2026, and the later period September 14–20. Each contains ten completed requests. Elapsed minutes run from receipt to resolution. This constructed exercise has no open, excluded or missing records; the periods are not paired observations of the same requests. More than 20 minutes is a preset exercise threshold, not an industry standard.
| Period | Individual elapsed times, minutes | Requests |
|---|---|---|
| Earlier | 8, 8, 8, 8, 8, 8, 8, 8, 8, 28 | 10 |
| Later | 4, 4, 4, 4, 4, 4, 4, 4, 26, 26 | 10 |
Elapsed time includes waiting and is not staff effort. Before discussing labor or removed steps, distinguish effort, waiting and elapsed time. In real work, account separately for requests still open at the end of the observation window. Completed records alone do not establish improvement for all requests.
Recompute the mean and median
The earlier total is 9 × 8 + 28 = 100 minutes, giving a mean of 100 ÷ 10 = 10. The later total is 8 × 4 + 2 × 26 = 84, giving 8.4. The relative decrease in the mean is (10 − 8.4) ÷ 10 = 16%.
For ten sorted observations, the median is the average of positions 5 and 6. It is 8 minutes earlier and 4 later. The middle becomes faster while long requests remain.
| Measure | Earlier | Later | What it describes |
|---|---|---|---|
| Sample size | 10 | 10 | Only ten records per period, not a population-wide result |
| Mean elapsed minutes | 10 | 8.4 | The average falls by 16% |
| Median minutes | 8 | 4 | The middle of the sorted observations falls |
| Maximum minutes | 28 | 26 | A slightly shorter maximum, separate from late counts |
| Requests over 20 minutes | 1 | 2 | One more long request |
| Share over 20 minutes | 10% | 20% | Up 10 percentage points, or 100% relative to the earlier share |
NIST's measures-of-location guide distinguishes the mean and median and explains their different behavior in skewed distributions. The numbers here come from independent simulated data, not empirical results from that source.
Put the distribution in the report
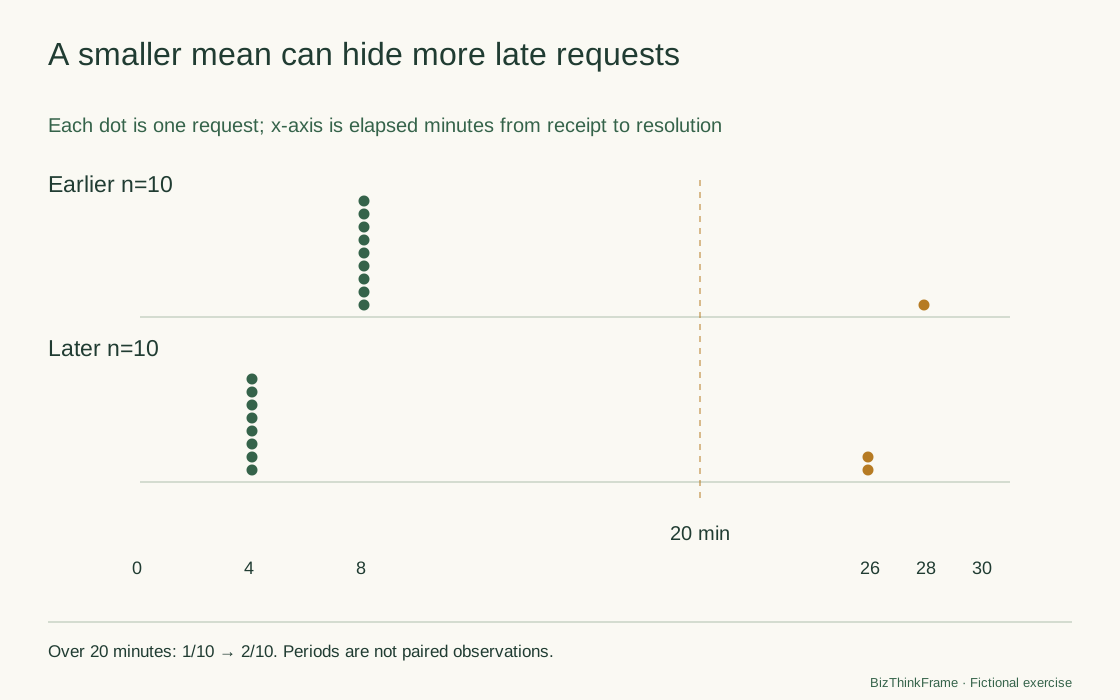
Both periods use the same axis and threshold. You can see the shorter observations as well as the two long later requests. Two bars showing only the means would conceal the latter fact.
An individual dot plot can show a small dataset; a histogram can group a larger one into defined intervals. Retain frequencies and bin definitions rather than smoothing the data into an unsupported continuous pattern. The chart selector helps check the required input conditions.
Narrow an overconfident statement
“Average elapsed time fell 16%, so service improved across the board” moves from one sample mean to an unsupported claim about everyone's experience.
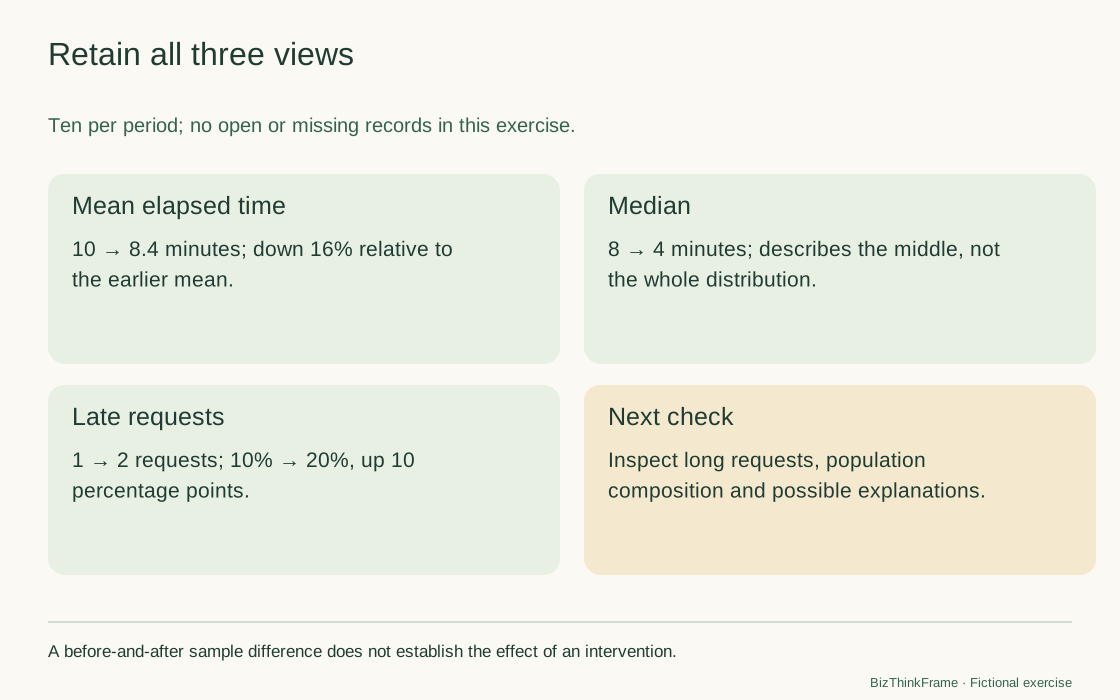
In this fictional exercise with ten completed requests per period, mean elapsed time falls from 10 to 8.4 minutes and the median from 8 to 4. Requests over 20 minutes rise from one to two. Most later observations are short, but the late count increases. Inspect those records and request composition before interpreting a real population change or its causes.
Equal sample sizes do not establish equal difficulty, channels, staffing or times of day. There is no randomized experiment here, so no new process can be credited with causing the difference. Keep “1/10 to 2/10” beside “10% to 20%” to make the small counts visible.
Check the mean alongside late requests
Explore the fictional case, then use your own records. Choose a threshold from the actual agreement rather than searching for a flattering result.
Earlier: completed 10; mean 10; median 8; maximum 28 minutes; >20 minutes: 1/10 (10%); missing 0; open 0
Later: completed 10; mean 8.4; median 4; maximum 26 minutes; >20 minutes: 2/10 (20%); missing 0; open 0
Relative change in mean elapsed time: -16%; Change in late count: 1; Change in late share: 10 percentage points
Dashed line: 20 minutes. Only values strictly above it are late; missing and open records have no dots.
Summaries use display rounding; late counts use each original value. The late-share denominator contains completed records with durations only; missing and open records are listed separately. Check periods, start/end events, units, duplicates, and sample composition. These results do not establish improvement for all requests or a process effect.
Review the complete record
Article's fictional elapsed-time example

2026-09-07 to 2026-09-13; 2026-09-14 to 2026-09-20

Original records:

earlier,8
earlier,8
earlier,8
earlier,8
earlier,8
earlier,8
earlier,8
earlier,8
earlier,8
earlier,28
later,4
later,4
later,4
later,4
later,4
later,4
later,4
later,4
later,26
later,26

Strictly greater than threshold (minutes): 20

Earlier: completed 10; mean 10; median 8; maximum 28 minutes; >20 minutes: 1/10 (10%); missing 0; open 0
Later: completed 10; mean 8.4; median 4; maximum 26 minutes; >20 minutes: 2/10 (20%); missing 0; open 0

Relative change in mean elapsed time: -16%; Change in late count: 1; Change in late share: 10 percentage points

Summaries use display rounding; late counts use each original value. The late-share denominator contains completed records with durations only; missing and open records are listed separately. Check periods, start/end events, units, duplicates, and sample composition. These results do not establish improvement for all requests or a process effect.
Reproduce the calculations
Put the CSV and Python script in the same directory and run python3 recalculate.py. The script prints a SHA-256 checksum, count, total, mean, median, maximum and late count for each period. The practice pack explains the fields and fictional data.
The check above accepts two columns per row: period and elapsed minutes. Missing and open records are listed separately, never as zero. Each period needs completed durations before comparing changes. If your table contains completed records only, establish which requests it omits.
For your own records, define receipt and resolution events, periods, units, duplicates, open requests and whether observations are paired before comparing statistics. To check the late-rate change, enter 1/10 and 2/10 in the rate-change tool and retain the sample limits. The calculator does not establish comparability.